How Is The Real Estate Market Doing In Peoria Ill?
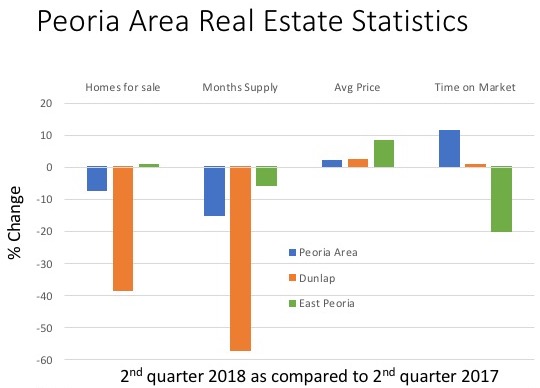
 The latest Real Estate Statistics for 2ndquarter are indicating that the Real Estate market in Peoria is improving as compared to 2ndquarter 2017. The chart above show a couple of key indicators that can help understand the current market conditions. I
In the above chart, Peoria Area consist of all areas within the area, including the smaller cities around Peoria. Whereas, Dunlap consist of everything with a Dunlap address. Same is true for East Peoria.
When looking at this chart remember that “REAL ESTATE MARKETS ARE LOCAL”. What is happening in the Peoria Area will be different than what is happening in Dunlap or Washington or East Peoria. Also what is happening in one neighborhood may be different than what is happening in another neighborhood located nearby.
Homes for Sale
The percent change in the number of homes for sale gives you an insight into what is happening with the inventory of homes for sale. If the percent change is negative, then the number of homes for sale has decreased.
The data above is indicating that percent change in the number of homes has decreased for the Peoria area and for Dunlap but in East Peoria it has increased slightly. This indicates that there are less homes for sale in 2ndquarter 2018 in the Peoria Area and Dunlap, but slightly more homes for sale in East Peoria.
The chart also indicates there is a relatively large reduction in homes available in Dunlap.
Month Supply
The percent change in the number of months supply gives you insight into supply of homes versus the demand for homes. If the percent change is negative, then buyers are buying more homes than what is becoming available. Hence demand is greater than the supply.
The data is indicating that the months supply of homes for the Peoria Area, Dunlap, and East Peoria, that the months supply has decreased since 2ndquarter 2017. This would indicate that buyers are buying homes at a faster rate than sellers are putting new homes on the market.
Average Price
The percent change in Average Price gives you insight into the direction prices are headed. If the average price is positive, this means that the average price of homes is going up. This stat has to be used carefully though. It can be misleading.
For example, a local manufacturer may decide to move their headquarters from the Peoria Area. This causes the movement of a number of high paying jobs out of the area and a large number of more expensive homes all of a sudden come on the market. As a higher percentage of higher priced homes get sold, this causes data for the average price of homes goes up. In reality, the prices of the more expensive homes may be sold at a discount to what they were originally bought for.
The data is showing that average price of homes sold for the Peoria Area, Dunlap and East Peoria have increased as compared to 2ndquarter 2017.
Time on the Market
The percent change in Time on the Market gives you insight into how long it is taking to sell a home. If the percent change is positive, it is taking longer to sell a home.
The data is indicating that it is taking slightly longer to sell you home in the Peoria area and Dunlap but less time in the East Peoria Market.
Summary
Looking at these four indicators, you could conclude that the Real Estate Market conditions are better in 2ndqtr 2018 and compared to 2ndqtr 2017. The number of homes for sale has reduced, the months supply has reduced, prices are slightly higher and time on the market is a little longer is some areas but less than others.